
The total cost line and the cost line can be used both for liquidity planning in the project and for project controlling. The following diagrams contain a comparison of the planned project cost and the actual project cost of a fictitious project. This type of representation is assigned to project controlling. An Excel template for the diagrams shown here can be found at the bottom of the page.
Cost line
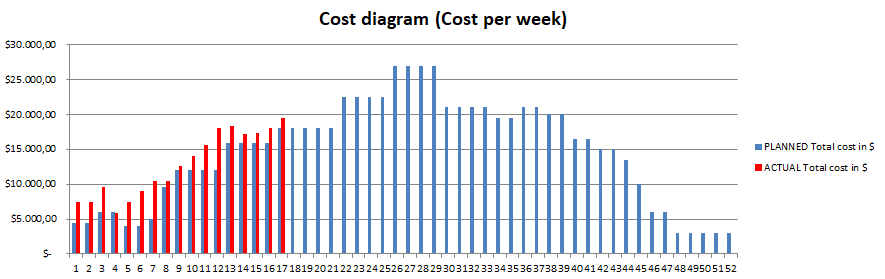
The cost line (shown here as a bar chart) shows the project costs planned (blue) and incurred (red) per time unit. In this example, the actual costs are higher than the planned costs.
Total cost line
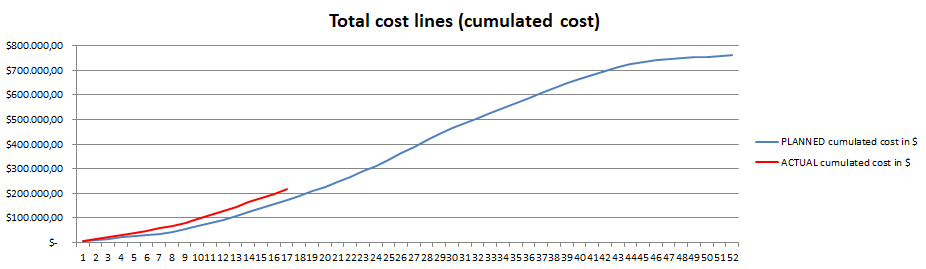
The total cost line shows the cumulative costs of the project. In this example, the planned costs are shown in blue, the actual costs in red. As soon as the rise of the red and blue lines differ, there is a plan deviation; in this example, the actual costs are above plan.
Here we have the Excel template that has been used for the diagrams of the cost line and the total cost line.