The question of which points belong in a project status report is closely linked to the question of what one wants to achieve with such a report. Usually, the reporting on the project status in the course of the project is a regularly recurring event that is intended to provide the stakeholders of the project with an overview of the current status and to give the opportunity to intervene in the ongoing project, if necessary. Good project management is characterized by the fact that this reporting takes place in a formal framework that ensures the minimum necessary information content.
The project status includes the following aspects, for which there are various reporting methods. In the following sections, the individual aspects are discussed in more detail, which are then summarized in the final project status report example.
Aspects of the project status report
1 Header data - general information about the project
The header data of the project status report should be consist of the
- Project title,
- a unique item number (ID),
- if necessary. a short description of the project,
- information on who is leading the project and other contacts in the project and
- the report date.
2 Project content - what content is currently being worked on?
The project content is usually organized in work packages. Each of these work packages can have different statuses in terms of processing:
- not started yet
- in progress
- on hold
- finished
These statuses can be easily visualized in an overview table.
3 Quality - do you have to compromise on the goals set?
There should be a list of requirements in the project that reflect the project objectives. These requirements should be differentiated into hard and soft requirements, i.e. between requirements that must be met (Mandatory) and requirements that would be nice-to-have (Optional).
The quality status of a project can be compared directly with these requirements; a traffic light system is best suited for visualization.
4 Project budget - are the costs on target?
Tracking costs

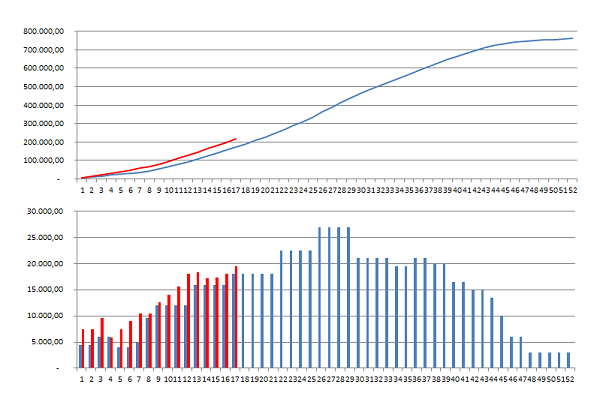
The project budget is usually monitored in the project status report with an updated cost line and total cost line. In addition, there are the cost forecasts explained below.
Cost forecast
The earned value method is suitable for creating a cost forecast. With this method, the previous effort is compared with the achieved degree of completion and derived from this how high the remaining effort will be.
In general, the earned value forecast can be expressed as follows:
\[ Estimation = \frac{Effort_{ACTUAL} (\%)}{Progress_{ACTUAL} (\%)} \cdot Budget \]
An example
If you have already spent 50% of the time processing a work package, but have only achieved 25% completion, the prognosis for this work package is 200%, assuming linearity, i.e. a doubling of the originally planned processing effort.
The quality of the forecast must be critically questioned, especially in the case of large deviations and at the beginning of work packages.
5 Milestones - can the planned timeline be kept?
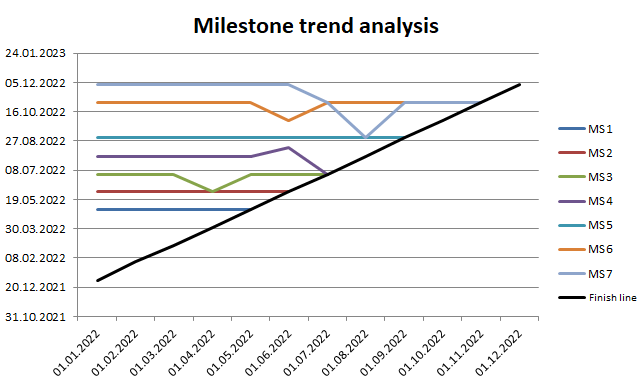
The deadlines are usually monitored within a project status using the milestone trend analysis. Appropriate milestone-based planning is required for this.

6 Measures - what has to change "from now"?
If there are deviations from the plan in the project (which is the normal case), an assessment must be made as to whether this results in a need for action or not. This assessment should also be documented if no need for action is seen.
In the project status report, a free text area is sufficient for the "Measures" section in which these measures are formulated accordingly. It makes sense to revisit the measures in the previous report in order to be able to conduct a kind of review.
But now let's get to the Project Status Report Example.
Project status report example
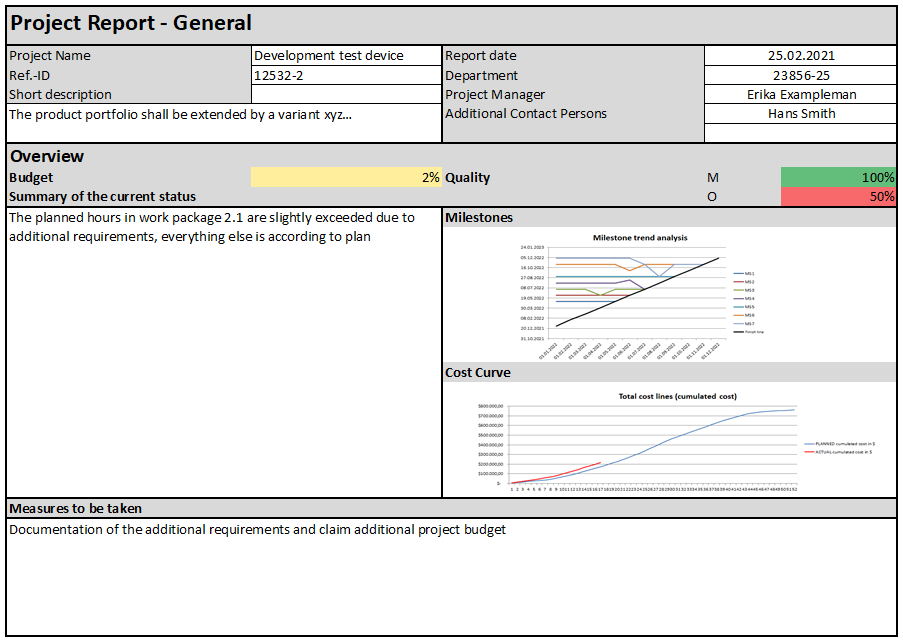
The following figures are an example of a project status report - further information can be added depending on the project character and risks.
Taking into account the aspects listed above, a project report could look like this - it should be noted that there is a breakdown into an overview view and a detailed view.

The overview shows a summary of the data that was collected in the project status. In this example there is only a percentage of the project budget, here of course information on the budget in a certain currency would also be useful. The quality traffic light provides an overview of how many of the mandatory requirements (M) and optional requirements (wishes) (O) can be achieved.
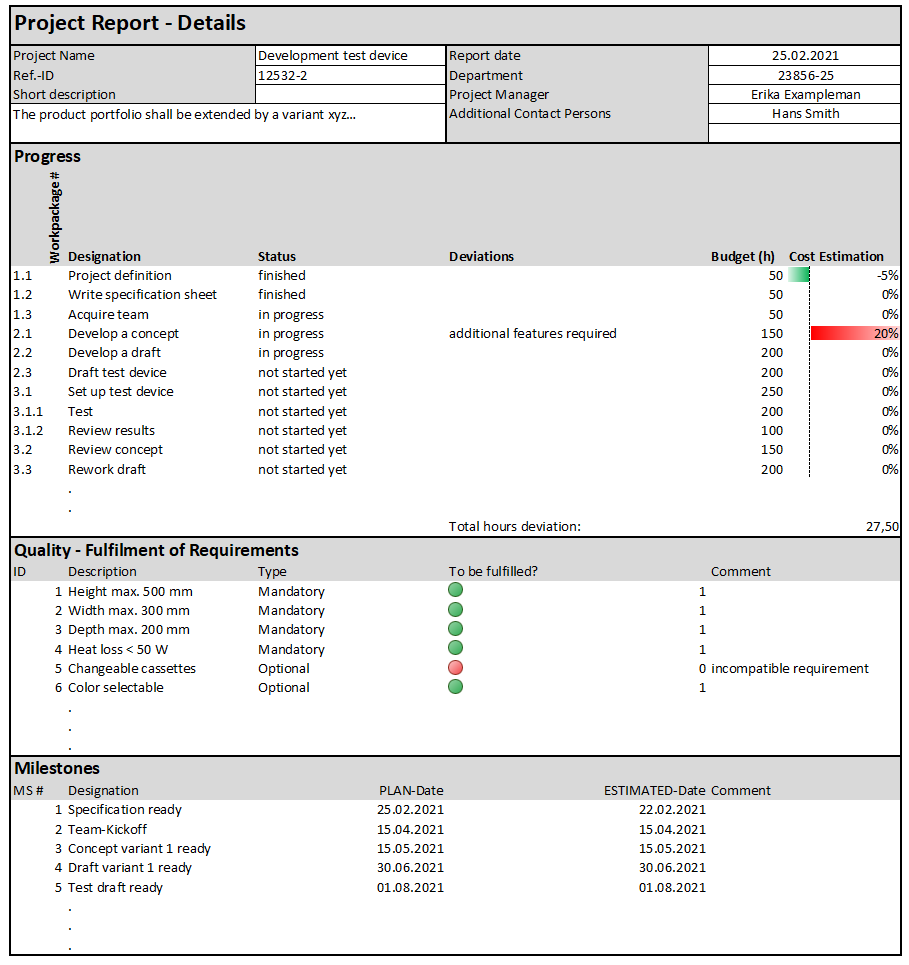
The detailed view provides further information.

The individual work packages are listed in the detailed view. You can see their status and the expected budget variance.
In the Quality section, the requirements are listed and visualized with a traffic light system.
The dates listed in the section "Milestones" form the basis for the milestone trend analysis on the overview page. I.e. the progress data for these milestones must also be kept, they cannot be seen here.

