The milestone trend analysis (MTA) is used in project management to keep an overview of the key dates of the project. It is updated regularly on the respective reporting dates.
The prerequisite for the effective use of the MTA is, as the name suggests, the planning of milestones or stage gates (phase gates) in the project as well as regular reporting.
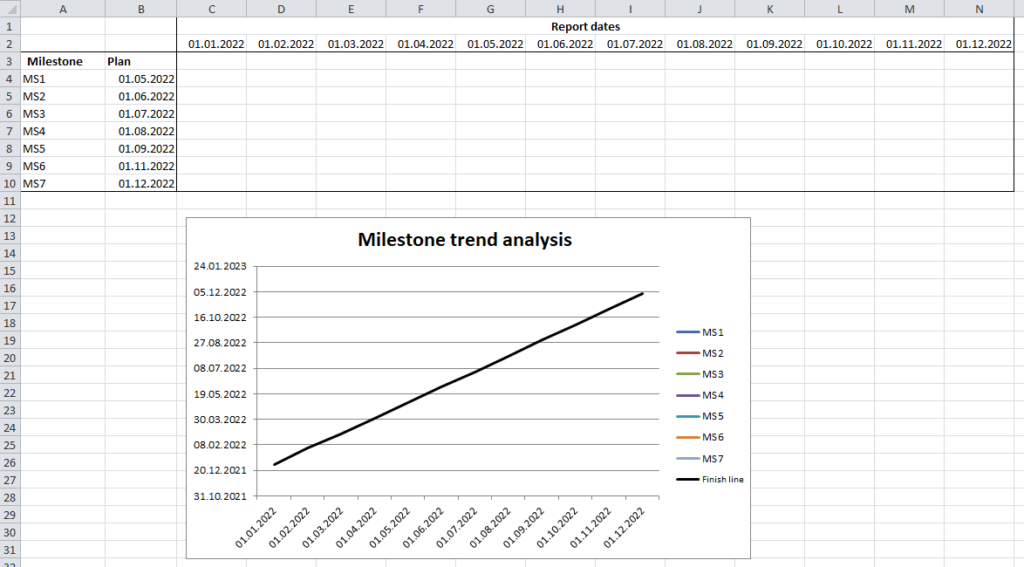
How do you fill the MTA?
The figure below shows the top left corner of the MTA. The different input fields are highlighted in color.
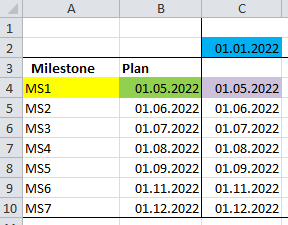
- Yellow: the designation of the milestone, here referred as MS1
- Green: the initial planned date of the milestone, here 01.05.2022
- Blue: the reporting date on which the estimate of the milestone dates is submitted
- Purple: the expected completion date for milestone MS1
The interpretation of the MTA is as follows:
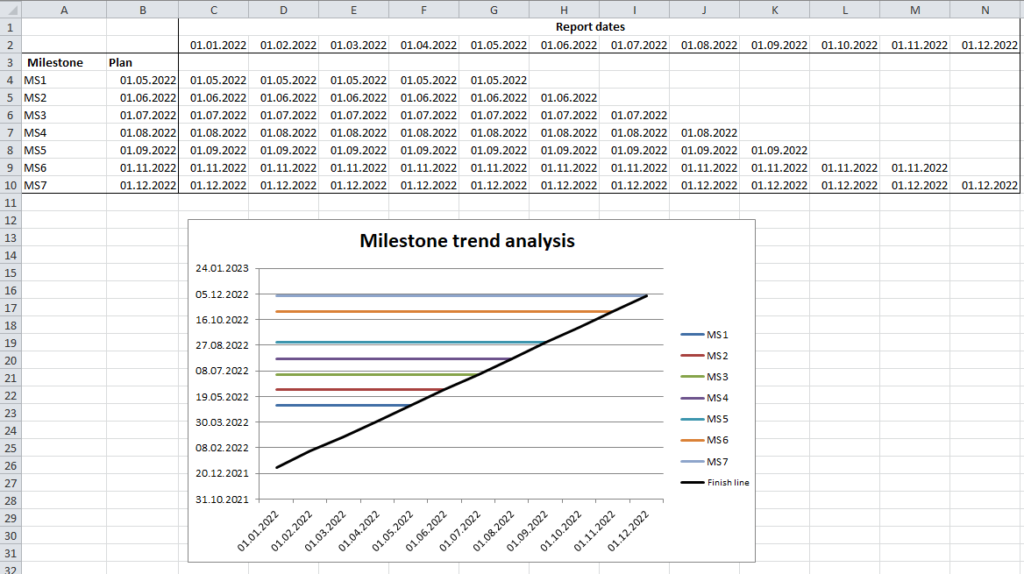
The project is going exactly as originally planned
The lines are all horizontal in this case. Each milestone has its own color in the following illustration.
The expected dates fluctuate, but things are going better than planned
The lines leave their original horizontal paths, but they run downwards towards the finish line (black).
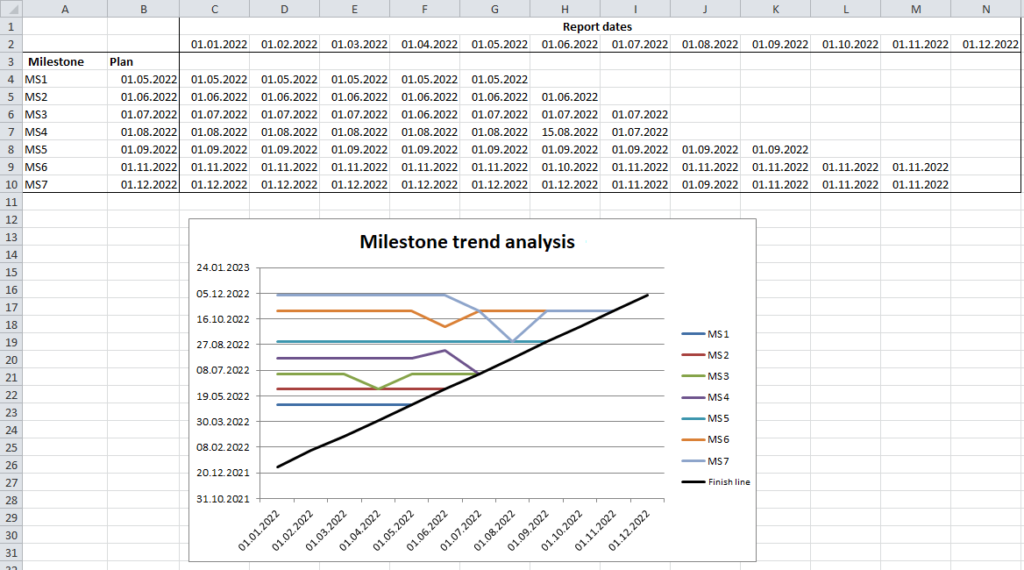
The expected dates vary, the project is taking longer than planned
The lines leave their horizontal path in an upward direction. A worst-case scenario is when the lines run upwards and move parallel to the finish line: in this case the project goal will not be achieved.
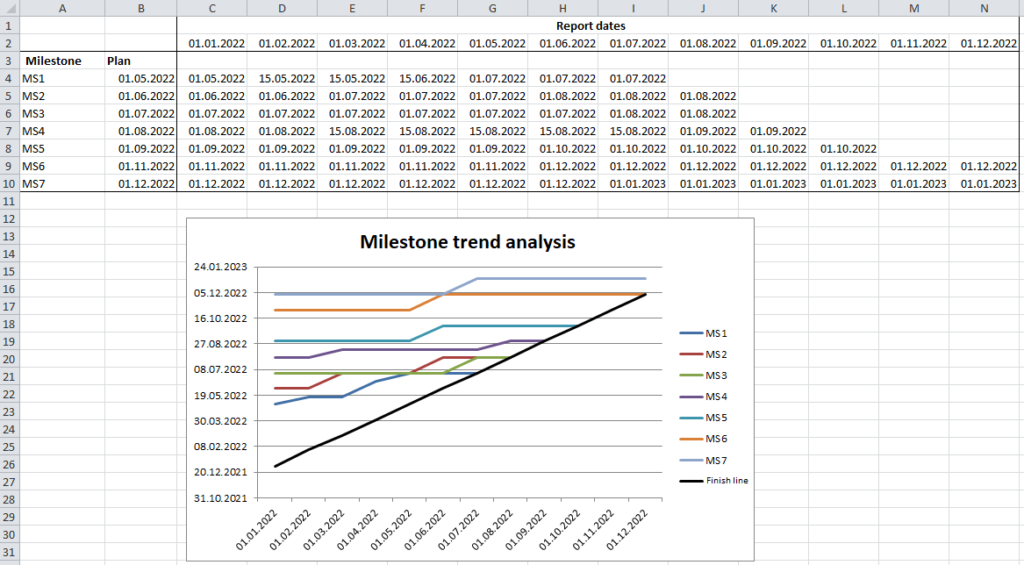
The Excel template
Please support this site by registering for the newsletter - we will send you the download link for the excel template for the milestone trend analysis in exchange.
If you don't want to support this site, you can download the excel template here.

